In this article, we will look at the integration of modern wind turbine generators (and by extension wind farms) into the electric power grids.
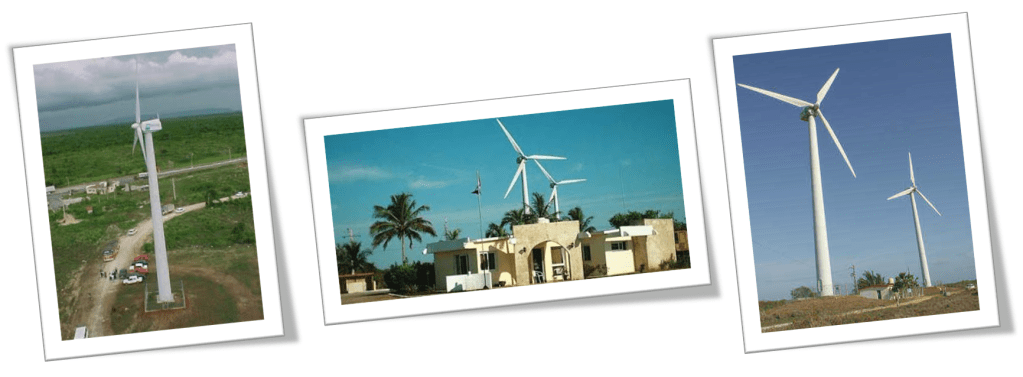
Modern wind turbine generator
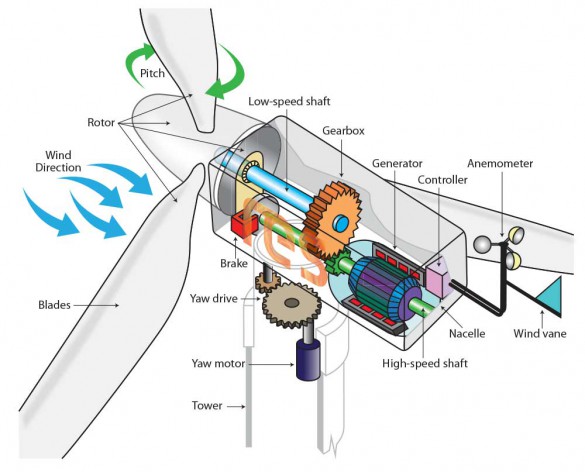
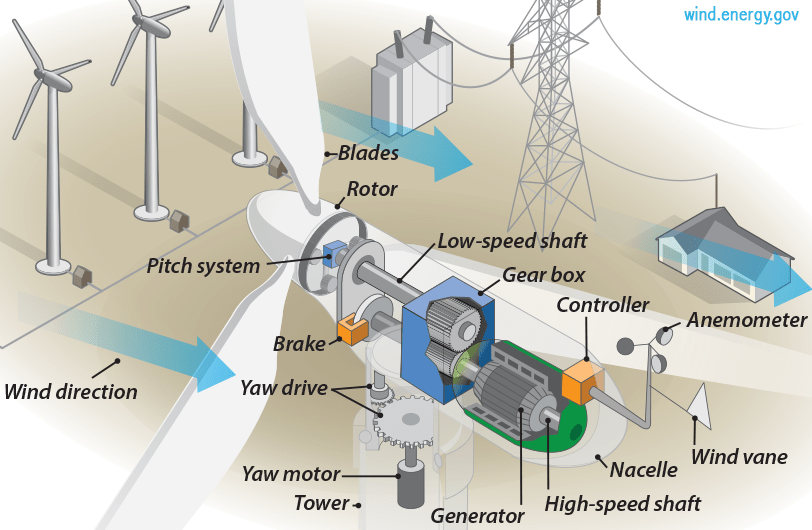
Modern wind turbine generators (WTG) can be broadly categorized as either vertical axis or horizontal axis. The horizontal axis wind turbine design is much more efficient at extracting power from the wind than a vertical axis wind turbine and is widely accepted as the industry standard design for large-scale applications. It generally consists of a rotor with three blades that are connected to the nacelle, which contains the electric generator and other auxiliary parts, via its hub. The nacelle houses the gearbox (where applicable), electric generator and other auxiliary parts at the top of the tower. An electric transformer, normally located at the base of the tower, is used to step up the voltage at the terminal of the generator (usually less than 1 kV) to a voltage level suitable for integration (usually medium voltage, i.e. up to 36 kV).

Wind energy conversion
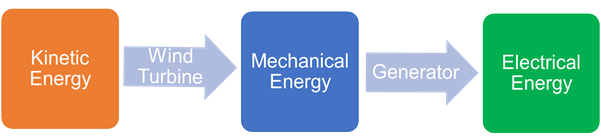
A WTG, like all other forms of power generators, is an energy conversion system. The wind turbine itself converts the kinetic energy in the wind to mechanical (or rotational) energy. The mechanical energy is then converted to electrical energy using one of several types of electric generators (alternator). Overall the WTG converts the energy in the wind into electrical energy that can be fed directly into modern power grids (micro, mini, island or interconnected) or used in standalone installations. The former is the focus of this article.
The mechanical power produced by a turbine is dependent on the air density, rotor swept area and wind speed as per the following expression.

where:
ρ – air density (typically 1.225 kg/m3 at sea level with standard conditions, i.e. at a temperature of 15 °C and an atmospheric pressure of 101.325 kPa)
A – area swept by the rotor blades
v – wind speed
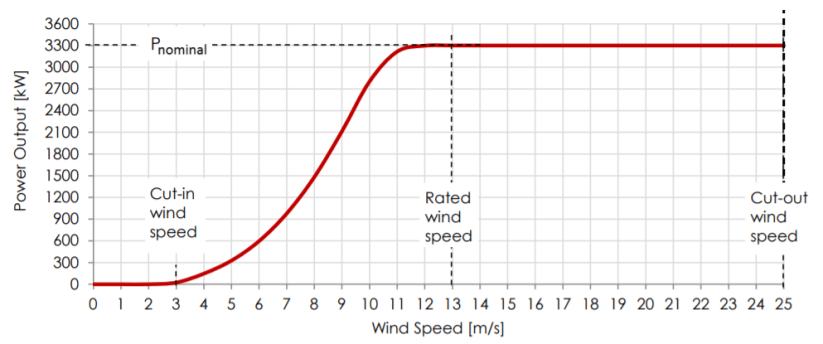
Cp – so-called power coefficient of the wind turbine. The power coefficient is a nonlinear function of the blade pitch angle (β) and the tip-speed ratio (λ). The electrical power (Pe) is usually given by the WTG power curve, as shown below.
The electrical power (Pe) is usually given by the WTG power curve, as shown below.
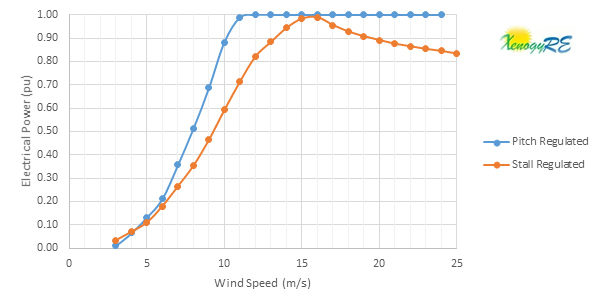
The electrical power curve also shows the impact of the various control techniques applied to the WTG. For example, stall regulated and pitch regulated. Stall and pitch regulation refers to the aerodynamic/mechanical control techniques that are applied to the turbine itself to ensure that the mechanical power produced by the turbine does not exceed the power rating of the electrical generator.
Stall regulation was primarily used on Type 1 WTG given its fixed speed nature. It involved the natural/aerodynamic stalling/slowing of the turbine blades at high wind speeds (generally above the rated wind speed) until the turbine stalls or shutdown occurs at the cut-out wind speed.
Pitch regulated, on the other hand, is the more modern of the two techniques and it involves the pitching or axial rotation of the turbine’s blades to control the rotational speed of the turbine’s shaft. This allows for optimization of the electrical output of the generator over the entire operating range of the WTG, hence it also helps to smooth the electrical output of the WTG.
Wind turbine integration concepts
A wind turbine integration concept primarily refers to the method used to convert the mechanical energy generated by the turbine to useful electrical energy. There are four industry-standard wind turbine integration concepts, namely, Type 1 WTG, Type 2 WTG, Type 3 WTG and Type 4 WTG as described below.
Type 1 WTG:
The Type 1 WTG is the simplest wind turbine integration concept. It is implemented with a squirrel-cage induction generator (SCIG) and is connected directly to the grid via its step-up (coupling) transformer, as shown below. The WTG speed is fixed (or nearly fixed) to the grid frequency, and it generates real power (P) when the WTG shaft rotates faster than the grid frequency (i.e under a negative slip condition). Slip is the difference between the grid speed (frequency) and the generator shaft speed. Positive slip occurs when the SCIG is operated as an electric motor.

Type 1 WTG are simple, robust and economical. However, one major drawback of the induction machine used herein is that it consumes reactive power for its excitation. The solution to this problem is usually to include capacitors within the nacelle or at the collector bus. Another drawback is the large currents the machine can draw when started “across-the-line.” To ameliorate this effect a thyristor-based (AC/AC controller) soft starter is generally used to manage the connection of the WTG to the grid on starting. See our previous article titled “Wind turbines – I’m a Big Fan!” for additional information on how a Type 1 WTG starts up.
Type 1 WTGs are installed at the following wind farms in the Caribbean:
- Wigton I wind farm in Jamaica. It consists of twenty-three (23) NM52/900kW WTGs. The NM52/900kW is a stall regulated turbine with a two speed (pole switching) SCIG.
- Maddens wind farm in St. Kitts. It consists of eight (8) GEV/275kW WTGs. The GEV/255kW is a pitch regulated turbine with a two speed (pole switching) SCIG.
Type 2 WTG:
Another problem with the Type 1 WTG generator is its near fixed speed operation (at approximately 1-2% slip), which cause large variation in electrical output during gusty wind conditions. This is because the aerodynamic control techniques described above are not fast enough to limit or smooth power output during these fast-changing wind conditions. The Type 2 WTG was developed to solve this problem in a cost-efficient manner.
In Type 2 WTG, the squirrel cage induction generator is replaced by a wound rotor induction generator with the stator circuit connected directly to the grid via the step-up transformer (as in the case of the Type 1 WTG) and a variable resistance wired into the rotor circuit, as shown below.

The variable resistance is generally accomplished with a resistor and power electronics external to the rotor with currents flowing between the resistors and rotor via slip rings. Alternately, the resistor and electronics can be mounted on the rotor, eliminating the slip rings.
The variable resistors control the rotor current so as to keep constant power even during gusting conditions. It allowed for a speed variation of 10% compared to the typical 1% slip of the Type 1 WTG. The corresponding drawback with this solution is that excess energy due to overspeeding from gusty conditions is dissipated in the resistors as waste heat energy. That is not a problem in itself, however, since the only alternative is to waste the excess wind energy by pitching the rotor blades out of the wind.
This concept is not used in any of the wind farms in the Caribbean. It was first introduced by Vestas in the early 1990s termed OptiSlip and formed part of the V39/600kV to V47/660kW WTGs. This was further enhanced and renamed OptiSpeed in Vestas Type 3 WTG design.
Type 3 WTG:
The Type 3 WTG, known commonly as the doubly-fed induction generator (DFIG) or doubly-fed asynchronous generator (DFAG), takes the Type 2 design to the next level, by adding variable frequency ac excitation (instead of simply variable resistance) to the wound rotor circuit, as shown below.
The additional rotor excitation is supplied via slip rings generally by a current regulated, voltage-source converter, which can adjust the magnitude and phase of the rotor currents nearly instantaneously. This rotor-side converter is connected back-to-back with a grid side converter, which exchanges power directly with the grid via the coupling transformer.

In the event of over‐speed conditions, the back-to-back convert absorbs this extra energy and provides additional output energy to the grid (this mode of operation is called super-synchronous mode). This energy would have been wasted as heat in a Type 2 WTG. On the other hand, when under‐speed conditions persist, the back-to-back converter extracts energy from the grid and supply this to the rotor (this mode of operation is called sub-synchronous mode). The converter is therefore bidirectional.
These two modes allow a much wider speed range, both above and below synchronous (grid) speed by up to 50%. The greatest advantage of the DFIG is that it offers the benefits of separate real and reactive power control, much like a traditional synchronous generator, while being able to run asynchronously.
The Type 3 WTG is the most widely used, on wind farms in the Caribbean, of the four concepts discussed here. For example, it is used on wind farms in the following islands:
- Jamaica – Wigton II & III and BMR wind farms (Vestas and Gamesa, respectively),
- Dominican Republic – All wind farms (Vestas and Gamesa),
- Puerto Rico – Punta Lima wind farm (Vestas)
- Aruba and Curacao – All wind farms (Vestas)
- Cuba – Gibara wind farms (Vestas and Goldwin)
All of which are pitch regulated.
Type 4 WTG:
The Type 4 WTG offers a great deal of flexibility in design and operation as the output of the rotating machine is sent to the grid through a full-scale back-to-back frequency converter, as shown below. The turbine is therefore allowed to rotate at its optimal aerodynamic speed, resulting in a “wild” AC output from the electrical generator.
In addition, the gearbox may be eliminated, such that the machine spins at the slow turbine speed and generates an electrical frequency well below that of the grid. This is no problem for a Type 4 WTG, as the back-to-back converter manages the difference in frequency, and also offers the possibility of reactive power support to the grid.

One advantage of a Type 4 WTG is that it can use any type of electrical generator (alternator), but is primarily fitted with wound rotor synchronous machines (WRSG), similar to those in hydroelectric plants, permanent magnet synchronous machines (PMSG), or SCIGs.
One drawback, however, is that the power electronic converters must be sized to pass the full rating of the rotating machine, plus any capacity to be used for reactive compensation. This increases the overall cost of ownership of the WTG.
Type 4 WTG can be found at the following wind farms in the Caribbean:
- Munro wind farm in Jamaican. It consists of four (4) U50/750 kW. The U50/750kW is a pitch regulated turbine with a PMSG.
- Morotin wind farm in Bonaire. It consists of twelve (12) E44/900kW. The E44/900kW is a pitch regulated turbine with a PMSG.
- Santa Isabela wind farms in Puerto Rico. It consists of forty-four (44) SWT108/2300kW. The SWT108/2300kW is a pitch regulated WTG with a SCIG.
Wind farm electrical connectivity
The following diagram illustrates the interconnectivity of the WTGs within the Wigton I wind farm in Jamaica.

In this plant, twenty (23) Type 1 WTGs are connected directly to the grid (i.e no power electronic converters) via step-up transformers that convert from the 690 V at the terminal of the WTGs to the collector feeder voltage of 24 kV. The top thirteen (13) WTGs are connected in a daisy-chain fashion (parallel) to create one collector circuit and the bottom ten (10) WTGs are similarly connected to form the other. The two feeders terminate on a 24 kV collector bus at the wind plant substation that is used to parallel connect the two collector circuits to the grid interconnection (station) transformer. The grid interconnection transformer steps up the voltage from the collector bus to 69 kV. In this case, the wind farm is interconnected to the utility grid via a single 69 kV transmission line.
In the next article, we will look at some of the technical requirements when integrating WTGs/wind farms into regional grids. These technical requirements are generally outlined in the national grid codes or interconnection agreements where no grid code exists.