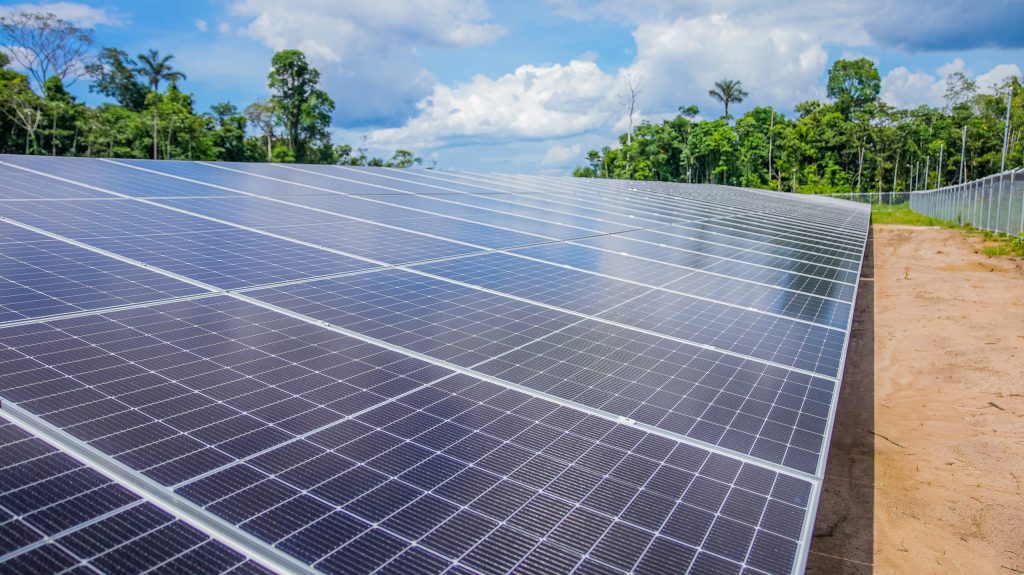
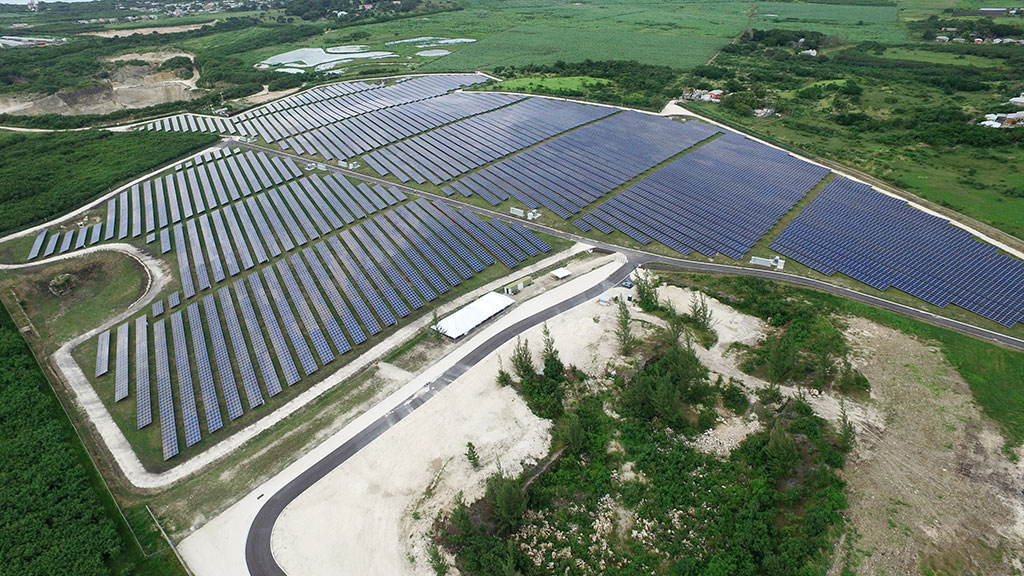
Guyana plans to install 33 MWp (megawatt peak) of grid-scale solar PV with battery storage in three of its un-interconnected (isolated) grids.
The Government of Guyana (GoG), notwithstanding the Country’s evolving oil and gas sector, is committed to the development of a cleaner, greener, and more diversified energy matrix that is based on indigenous resources as outlined in its recently published 2030 Low Carbon Development Strategy (LCDS). Aside from having the capacity to utilize hydropower, wind, and biomass, Guyana has significant solar PV potential.
Guyana has a long-term average global horizontal irradiance (GHI) of 5.0-5.9 kWh/m2 (kilowatt-hours per square meter) per day, based on satellite data. To put things in perspective, Germany, which has approximately 6.8% of the world’s installed solar PV capacity at the end of 2021, has very few locations with a GHI above 3.5 kWh/m2/day.
As such, the GoG has given the Guyana Power and Light Inc. (GPL) the mandate to utilize NORAD funding to execute a national solar photovoltaic (PV) project in alignment with its plans to increase renewable energy penetration and grid stability on the power system. The project will be administered through the Inter-American Development Bank (IDB) with GPL being the execution agency
The program is targeting eight projects totalling 33 MWp of solar PV in three of the country’s grids (Guyana has several un-interconnected grids) as follows:
15 MWp with a 15 MW, 1hr Battery Energy Storage System (BESS) in the Linden Isolated Power System (LIS),
8 MWp with an 8MW, 1hr BESS in the Essequibo Coast Isolated Power System (EIS), and
10 MWp in the Demerara-Berbice Interconnected System (DBIS)
The Linden project
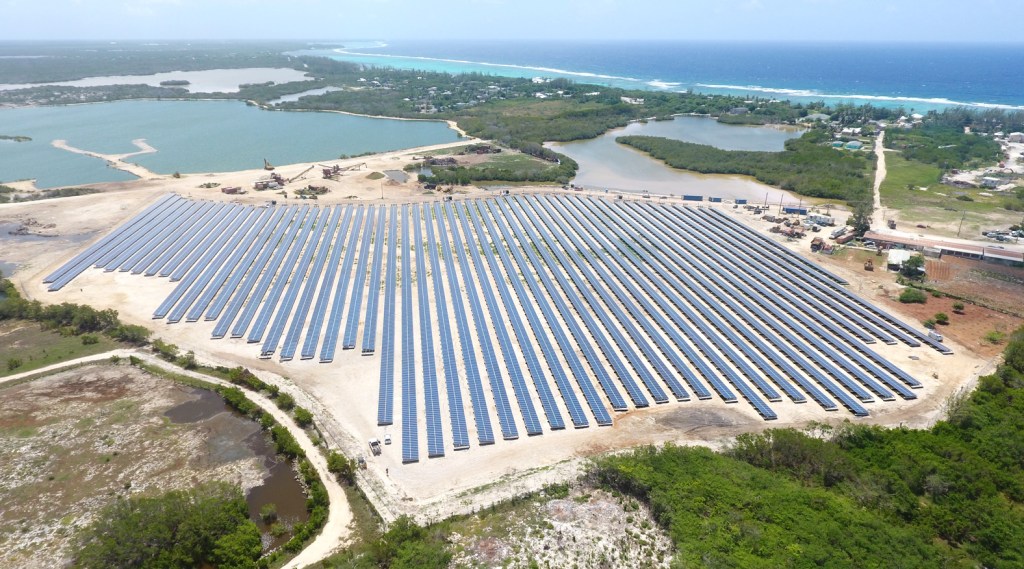
The Linden project will involve three (3) PV farms, each rated at 5 MWp. The plants are proposed to be located at Block 37 (in the vicinity of Bamia on the Linden Soesdyke Highway), Retrieve on the eastern side of the Demerara River, and Dacoura on the western side of the Demerara River.
The Block 37 plant will be interconnected to the Amelia’s Ward 13.8 kV feeder, whilst the Dacoura plant will be interconnected to the Wismar 13.8 kV feeder. The Retrieve plant will, however, be interconnected directly to the 13.8 kV Retrieve substation.
In addition, given the high level of penetration, a total of 15 MW (megawatt), with a minimum duration of 1 hour, of battery energy storage system (BESS) will also be installed and interconnected to the Linden system for stability purposes.
The Linden project will initially satisfy approximately 38% of the demand with an average annual generation of 20.12 million kWh (kilowatt-hour). This will result in approximately 17,182 tons of CO2 (carbon dioxide) being avoided annually.
The Essequibo Coast project
The Essequibo Coast project will involve two (2) PV farms, rated at 4.4 and 3.6 MWp. The plants are to be located at Ondereeming and Lima Sands, respectively.
The Onderneeming plant will be interconnected to the South 13.8 kV feeder, while the Lima Sands plant will be interconnected to the North 13.8 kV feeder.
Much like the Linden project, given the high level of penetration, a total of 8 MW (megawatt), with a minimum duration of 1 hour, of BESS will be installed and interconnected to the Essequibo Cost system for stability purposes.
The Essequibo Coast project will initially satisfy approximately 28% of the demand with an average annual generation of 12.36 million kWh, which will result in approximately 9,390 tons of CO2 being avoided annually.
The Berbice Project
The Berbice project will involve three (3) PV farms. A 4 MWp plant at Trafalgar on the west coast of the Berbice; a 2 MWp plant at Prospect on the east coast of the Berbice; and a 4 MWp plant at Hampshire in Corentyne, Berbice.
The Trafalgar and Prospect farms will interconnect via an express 13.8 kV line to the 13.8 kV busbar at the Onverwagt and Canefield substations respectively. The Hampshire farm will interconnect to the Canfield F3 13.8 kV feeder.
These plants will be a part of the DBIS and will satisfy a very small portion of the demand of the DBIS. However, the distributed nature of the project will serve to support the distribution network and reduce losses by supplying power closer to the end user.
The plants will generate approximately 16.14 million kWh annually, which will result in the avoidance of 10,671 tons of CO2 annually.
The estimated energy production and land requirements for each plant are shown in Table 1 below.
Site
Plant Size (MW)
System
Yearly PV Energy Production (MWh)
DC Capacity Factor
Land Requirement (acres)
Prospect, East Coast Berbice
3.0
DBIS
4,842
18
15
Hampshire, East Coast Berbice
3.0
DBIS
4,842
18
15
Trafalgar, West Coast Berbice
4.0
DBIS
6,459
18
20
Lima Sands, Essequibo Coast
3.6
EIS
5,560
18
18
Onderneeming, Essequibo Coast
4.4
EIS
6,795
18
22
Block 37, Linden
5.0
LIS
6,707
15
15
Retrieve, Linden
5.0
LIS
6,707
15
15
Decoura, Linden
5.0
LIS
6,707
15
15
Table 1
Project Funding
All eight projects form part of the Guyana Utility-scale Solar Photovoltaic Program (GUYSOL) and will be funded through the Norwegian Agency for Development Cooperation (NORAD) Fund. The non-reimbursable funding, which amounts to US$83.3 million is structured as shown in Table2:
Table 2
The deadline for commencement of the works under the program is two years, counted from the effectiveness of the Non-reimbursable Financing Agreement, which was signed on 13th September 2022 and made effective as of the 15th June 2022.
On the 11th April 2018, the St. Lucia Electricity Services Limited (LUCELEC) – the sole electric utility company on the island – completed the commissioning of the island’s first utility-scale solar PV plant. The plant is rated at 3 megawatt (MW) and is located in La Tourney, Vieux Fort, just north of the Hewanorra International Airport. The plant was officially opened on the 9th August 2018.
On the 20th June 2017, LUCELEC signed a contract with the preferred bidder Grupotec to engineer, procure and construct (EPC) the 3 MW PV plant. The official groundbreaking ceremony was held on the 29th September 2017, however, construction started in November 2017.
The plant consists of approximately 14,900 panels, which are distributed across three sites over a total of approximate 15 acres of land. It has a peak power rating (on the dc side) of 4 MW and is interconnected to the LUCELEC grid via two feeders emanating from the Vieux Fort substation at 11,000 volts.
Plant Performance
The solar farm was designed to generate 7 million kilowatt-hours (kwh) of electricity per year (at a capacity factor of 26.6%), which represented about 1.3% of the electricity generated from LUCELEC’s Cul De Sac Power Plant (the only other power plant on the island), at the time. Therefore it was projected to reduce the annual volume of fuel purchased by LUCELEC by more than 300 thousand imperial gallons and CO2 emission by 3800 metric tons. LUCELEC used approximately 19 million gallons of fuel per year, at the time.
In 2018 the solar farm generated 5.01 million kWh of electricity, which resulted in fuel savings of 257.7 thousand imperial gallons of deisel and corresponding cost savings of EC$1.99 million. To date, it has produced 24.7 million kWh of electricity leading to a fuel savings of 1.27 million imperial gallons and cost savings of EC$9.1 million. Table 1 below shows the breakdown of the energy production, fuel savings and cost savings for 2019, 2020 and 2021.
Year
Energy Produced (million kWh)
Capacity Factor (%)
Fuel Savings (thousand Imperial Gal)
Cost Savings (EC$)
2019
6.84
26.0
352.0
2.66
2020
6.58
25.0
337.4
2.13
2021
6.26
23.8
319.8
2.23
Table 1
Outlook
Looking ahead, LUCELEC is working on plans to install a 7.5 MW/3 MWh utility-scale battery storage system in Vieux Fort to support the existing PV plant as well as to install another 10 MW solar PV plant with battery storage on the east coast of the island.
In this article, we will look at the integration of modern wind turbine generators (and by extension wind farms) into the electric power grids.
Modern wind turbine generator
Modern wind turbine generators (WTG) can be broadly categorized as either vertical axis or horizontal axis. The horizontal axis wind turbine design is much more efficient at extracting power from the wind than a vertical axis wind turbine and is widely accepted as the industry standard design for large-scale applications. It generally consists of a rotor with three blades that are connected to the nacelle, which contains the electric generator and other auxiliary parts, via its hub. The nacelle houses the gearbox (where applicable), electric generator and other auxiliary parts at the top of the tower. An electric transformer, normally located at the base of the tower, is used to step up the voltage at the terminal of the generator (usually less than 1 kV) to a voltage level suitable for integration (usually medium voltage, i.e. up to 36 kV).
Parts of a wind turbine
Wind energy conversion
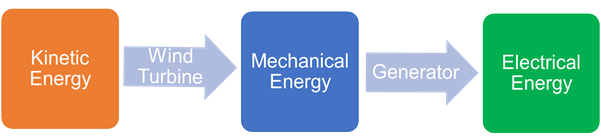
A WTG, like all other forms of power generators, is an energy conversion system. The wind turbine itself converts the kinetic energy in the wind to mechanical (or rotational) energy. The mechanical energy is then converted to electrical energy using one of several types of electric generators (alternator). Overall the WTG converts the energy in the wind into electrical energy that can be fed directly into modern power grids (micro, mini, island or interconnected) or used in standalone installations. The former is the focus of this article.
Wind energy conversion process
The mechanical power produced by a turbine is dependent on the air density, rotor swept area and wind speed as per the following expression.
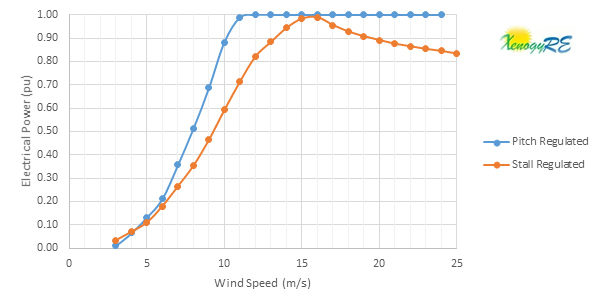
where: ρ – air density (typically 1.225 kg/m3 at sea level with standard conditions, i.e. at a temperature of 15 °C and an atmospheric pressure of 101.325 kPa) A – area swept by the rotor blades v – wind speed Cp – so-called power coefficient of the wind turbine. The power coefficient is a nonlinear function of the blade pitch angle (β) and the tip-speed ratio (λ). The electrical power (Pe) is usually given by the WTG power curve, as shown below.
The electrical power (Pe) is usually given by the WTG power curve, as shown below.
WTG power curve (pitch regulated vs stall regulated)
The electrical power curve also shows the impact of the various control techniques applied to the WTG. For example, stall regulated and pitch regulated. Stall and pitch regulation refers to the aerodynamic/mechanical control techniques that are applied to the turbine itself to ensure that the mechanical power produced by the turbine does not exceed the power rating of the electrical generator.
Stall regulation was primarily used on Type 1 WTG given its fixed speed nature. It involved the natural/aerodynamic stalling/slowing of the turbine blades at high wind speeds (generally above the rated wind speed) until the turbine stalls or shutdown occurs at the cut-out wind speed.
Pitch regulated, on the other hand, is the more modern of the two techniques and it involves the pitching or axial rotation of the turbine’s blades to control the rotational speed of the turbine’s shaft. This allows for optimization of the electrical output of the generator over the entire operating range of the WTG, hence it also helps to smooth the electrical output of the WTG.
Wind turbine integration concepts
A wind turbine integration concept primarily refers to the method used to convert the mechanical energy generated by the turbine to useful electrical energy. There are four industry-standard wind turbine integration concepts, namely, Type 1 WTG, Type 2 WTG, Type 3 WTG and Type 4 WTG as described below.
Type 1 WTG:
The Type 1 WTG is the simplest wind turbine integration concept. It is implemented with a squirrel-cage induction generator (SCIG) and is connected directly to the grid via its step-up (coupling) transformer, as shown below. The WTG speed is fixed (or nearly fixed) to the grid frequency, and it generates real power (P) when the WTG shaft rotates faster than the grid frequency (i.e under a negative slip condition). Slip is the difference between the grid speed (frequency) and the generator shaft speed. Positive slip occurs when the SCIG is operated as an electric motor.
Type 1 WTG are simple, robust and economical. However, one major drawback of the induction machine used herein is that it consumes reactive power for its excitation. The solution to this problem is usually to include capacitors within the nacelle or at the collector bus. Another drawback is the large currents the machine can draw when started “across-the-line.” To ameliorate this effect a thyristor-based (AC/AC controller) soft starter is generally used to manage the connection of the WTG to the grid on starting. See our previous article titled “Wind turbines – I’m a Big Fan!” for additional information on how a Type 1 WTG starts up.
Type 1 WTGs are installed at the following wind farms in the Caribbean:
Wigton I wind farm in Jamaica. It consists of twenty-three (23) NM52/900kW WTGs. The NM52/900kW is a stall regulated turbine with a two speed (pole switching) SCIG.
Maddens wind farm in St. Kitts. It consists of eight (8) GEV/275kW WTGs. The GEV/255kW is a pitch regulated turbine with a two speed (pole switching) SCIG.
Type 2 WTG:
Another problem with the Type 1 WTG generator is its near fixed speed operation (at approximately 1-2% slip), which cause large variation in electrical output during gusty wind conditions. This is because the aerodynamic control techniques described above are not fast enough to limit or smooth power output during these fast-changing wind conditions. The Type 2 WTG was developed to solve this problem in a cost-efficient manner.
In Type 2 WTG, the squirrel cage induction generator is replaced by a wound rotor induction generator with the stator circuit connected directly to the grid via the step-up transformer (as in the case of the Type 1 WTG) and a variable resistance wired into the rotor circuit, as shown below.
Type 2 – Variable Speed, wound rotor induction generators with variable rotor resistance (Molina & Mercado, 2011)
The variable resistance is generally accomplished with a resistor and power electronics external to the rotor with currents flowing between the resistors and rotor via slip rings. Alternately, the resistor and electronics can be mounted on the rotor, eliminating the slip rings.
The variable resistors control the rotor current so as to keep constant power even during gusting conditions. It allowed for a speed variation of 10% compared to the typical 1% slip of the Type 1 WTG. The corresponding drawback with this solution is that excess energy due to overspeeding from gusty conditions is dissipated in the resistors as waste heat energy. That is not a problem in itself, however, since the only alternative is to waste the excess wind energy by pitching the rotor blades out of the wind.
This concept is not used in any of the wind farms in the Caribbean. It was first introduced by Vestas in the early 1990s termed OptiSlip and formed part of the V39/600kV to V47/660kW WTGs. This was further enhanced and renamed OptiSpeed in Vestas Type 3 WTG design.
Type 3 WTG:
The Type 3 WTG, known commonly as the doubly-fed induction generator (DFIG) or doubly-fed asynchronous generator (DFAG), takes the Type 2 design to the next level, by adding variable frequency ac excitation (instead of simply variable resistance) to the wound rotor circuit, as shown below.
The additional rotor excitation is supplied via slip rings generally by a current regulated, voltage-source converter, which can adjust the magnitude and phase of the rotor currents nearly instantaneously. This rotor-side converter is connected back-to-back with a grid side converter, which exchanges power directly with the grid via the coupling transformer.
Type 3 – Variable speed, wound induction generators with a rotor-side converter (Molina & Mercado, 2011)
In the event of over‐speed conditions, the back-to-back convert absorbs this extra energy and provides additional output energy to the grid (this mode of operation is called super-synchronous mode). This energy would have been wasted as heat in a Type 2 WTG. On the other hand, when under‐speed conditions persist, the back-to-back converter extracts energy from the grid and supply this to the rotor (this mode of operation is called sub-synchronous mode). The converter is therefore bidirectional.
These two modes allow a much wider speed range, both above and below synchronous (grid) speed by up to 50%. The greatest advantage of the DFIG is that it offers the benefits of separate real and reactive power control, much like a traditional synchronous generator, while being able to run asynchronously.
The Type 3 WTG is the most widely used, on wind farms in the Caribbean, of the four concepts discussed here. For example, it is used on wind farms in the following islands:
Jamaica – Wigton II & III and BMR wind farms (Vestas and Gamesa, respectively),
Dominican Republic – All wind farms (Vestas and Gamesa),
Puerto Rico – Punta Lima wind farm (Vestas)
Aruba and Curacao – All wind farms (Vestas)
Cuba – Gibara wind farms (Vestas and Goldwin)
All of which are pitch regulated.
Type 4 WTG:
The Type 4 WTG offers a great deal of flexibility in design and operation as the output of the rotating machine is sent to the grid through a full-scale back-to-back frequency converter, as shown below. The turbine is therefore allowed to rotate at its optimal aerodynamic speed, resulting in a “wild” AC output from the electrical generator.
In addition, the gearbox may be eliminated, such that the machine spins at the slow turbine speed and generates an electrical frequency well below that of the grid. This is no problem for a Type 4 WTG, as the back-to-back converter manages the difference in frequency, and also offers the possibility of reactive power support to the grid.
Type 4 – Variable speed, conventional generator with a full-scale converter (Molina & Mercado, 2011)
One advantage of a Type 4 WTG is that it can use any type of electrical generator (alternator), but is primarily fitted with wound rotor synchronous machines (WRSG), similar to those in hydroelectric plants, permanent magnet synchronous machines (PMSG), or SCIGs.
One drawback, however, is that the power electronic converters must be sized to pass the full rating of the rotating machine, plus any capacity to be used for reactive compensation. This increases the overall cost of ownership of the WTG.
Type 4 WTG can be found at the following wind farms in the Caribbean:
Munro wind farm in Jamaican. It consists of four (4) U50/750 kW. The U50/750kW is a pitch regulated turbine with a PMSG.
Morotin wind farm in Bonaire. It consists of twelve (12) E44/900kW. The E44/900kW is a pitch regulated turbine with a PMSG.
Santa Isabela wind farms in Puerto Rico. It consists of forty-four (44) SWT108/2300kW. The SWT108/2300kW is a pitch regulated WTG with a SCIG.
Wind farm electrical connectivity
The following diagram illustrates the interconnectivity of the WTGs within the Wigton I wind farm in Jamaica.
Electrical oneline diagram of a wind farm
In this plant, twenty (23) Type 1 WTGs are connected directly to the grid (i.e no power electronic converters) via step-up transformers that convert from the 690 V at the terminal of the WTGs to the collector feeder voltage of 24 kV. The top thirteen (13) WTGs are connected in a daisy-chain fashion (parallel) to create one collector circuit and the bottom ten (10) WTGs are similarly connected to form the other. The two feeders terminate on a 24 kV collector bus at the wind plant substation that is used to parallel connect the two collector circuits to the grid interconnection (station) transformer. The grid interconnection transformer steps up the voltage from the collector bus to 69 kV. In this case, the wind farm is interconnected to the utility grid via a single 69 kV transmission line.
In the next article, we will look at some of the technical requirements when integrating WTGs/wind farms into regional grids. These technical requirements are generally outlined in the national grid codes or interconnection agreements where no grid code exists.
In this article, we will look at some of the wind turbine design parameters that are specific to wind farm sites.
Wind turbine design parameters
Modern wind turbines are designed for specific wind conditions, which varies from site to site. Therefore, when planning a wind power plant careful considerations must be given to the wind turbine classification. The International Electrotechnical Commission (IEC) defines various wind turbine classes in its IEC 61400-1 standard to which manufacturers design their turbines. The standard wind turbine classes are defined in terms of wind speed and turbulence parameters, as shown in the following table.
Source: DNVGL
The roman numbers I, II and III represent turbines designed for high, medium and low wind speed sites, respectively. S is to be used by manufacturers for turbines that fall outside of the I, II and III classifications. The wind speed classification is primarily dependent on the reference wind speed (Vref), which is the extreme (maximum) 10-minute average (mean) wind speed expected, at the turbine hub height, with a recurrence period of 50 years. The average wind speed is derived from the reference speed as Vave = 0.2* Vref. The letters, on the other hand, define the reference turbulence intensity (Iref) at 15 m/s, where class A, B and C represents turbines designed for sites with high, medium and low turbulence characteristics, respectively. Turbulence is dependent on surface roughness, terrain, surface heat flux and the wake from nearby turbines.
Therefore, the optimal turbine for a site must have design ratings that match or exceed the local site wind conditions. Thus, a turbine with an IEC IA rating is designed for sites with high wind speeds and high turbulence intensity, as further illustrated below in a brief study of the Wigton III wind farm in Jamaica.
Wigton III case study
As an example case study, let’s look at the turbine selection for Wigton III, which was commissioned in 2016 as the third phase of the Wigton wind farm. It consists of twelve (12) Gamesa G80 wind turbines and it is located at Rose Hill, Manchester, Jamaica. The G80 turbine formed part of Gamesa’s 2.0 MW platform, as shown in the table below and it has an IEC IA class rating.
Source: Gamesa
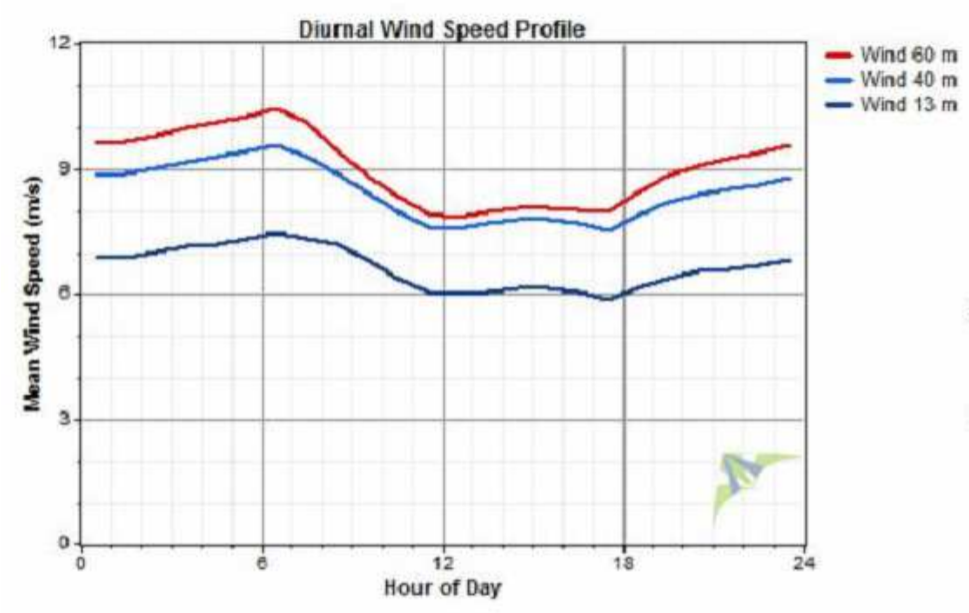
In order to double-check the turbine selection for the Wigton III wind farm let’s take a looked at the mean wind speed and the turbulence intensity recorded at the Rose Hill site during the preliminary wind resource assessment stage of the wind farm’s development.
The figure below shows the mean diurnal wind speed profile at heights of 13, 40 and 60 meters (m) above ground. If we narrow in on the 60m profile, we will see that the diurnal wind speed varies between 6.90 to 10.88 meters per second (m/s) in an average day with a mean of 9.04 m/s and a standard deviation of 0.772 m/s. Given that the mean wind speed of the Rose Hill site is above the design values for the low (7.5 m/s) and medium (8.5 m/s) turbine wind speed classes, the optimum wind turbine for this site must be rated for high wind speed (i.e with a mean wind speed of up to10 m/s). This justifies Wigton’s selection of the G80 turbine, with its Class I rating.
Source: Wigton Wind Farm Ltd.
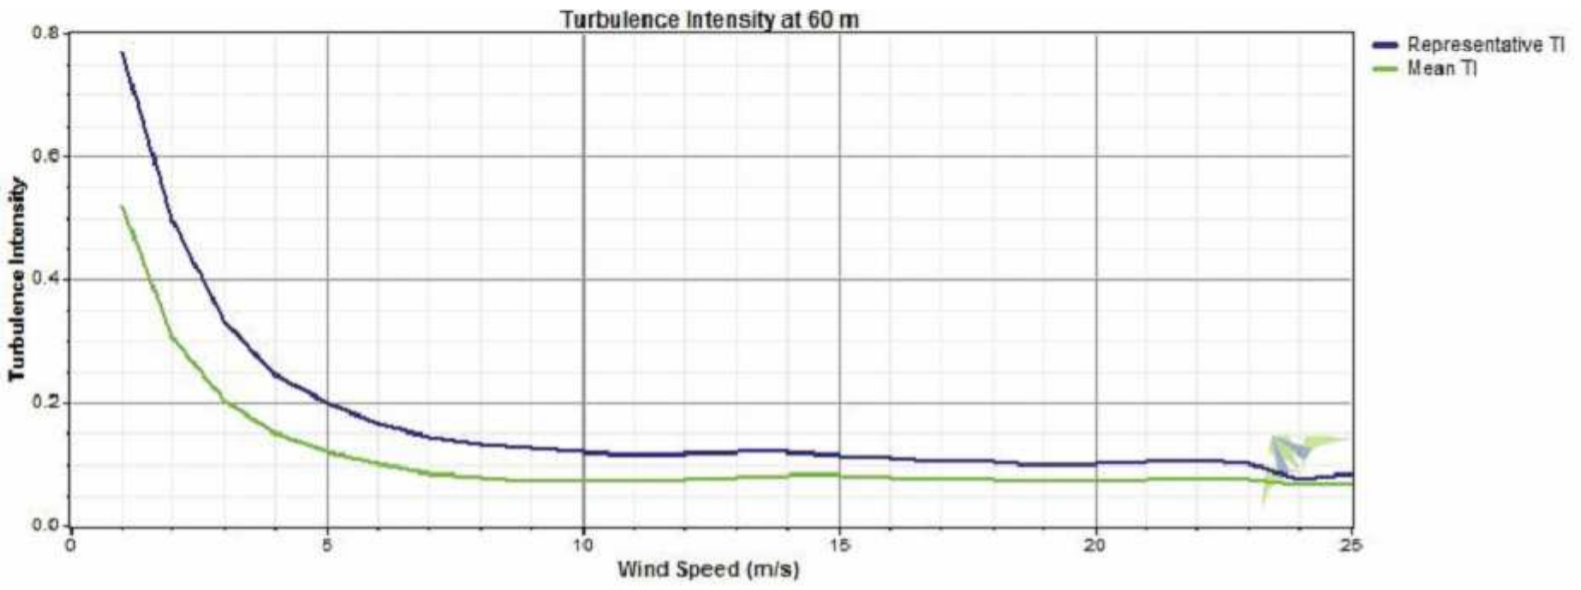
The next figure shows the turbulence intensity versus wind speed of up to 25 m/s. We can see that the mean and representative turbulence intensities are approximately 0.08 and 0.12 at 15 m/s, respectively. This implies that a turbine rated for low turbulence intensity (i.e with mean turbulence intensity of 0.12) is adequate for this site. However, this turbulence intensity represents the case of an isolated wind turbine, but consideration must also be given to the turbulence resulting from the wake of other turbines installed on the wind site. This in addition to the proven options available from Gamesa, at the time, meant that only the G80 turbine would have met the wind speed class and hence Wigton’s selection.
Source: Wigton Wind Farm
Annual energy estimation
Once the optimal turbine has been selected for a particular wind site, the annual energy production (and capacity factor) can be estimated from the wind speed distribution of the site and the selected wind turbine power curve. For example, the power curve for the G80 is shown below. It has cut-in, rated and cut-out wind speeds of 3.5, 15, 25 m/s, respectively.
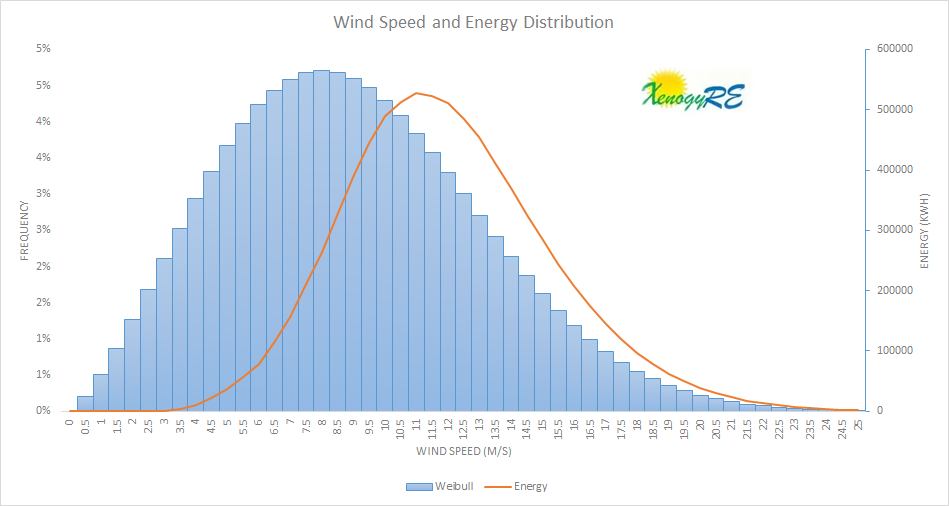
The wind speed distribution of the Rose Hill site is illustrated in the figure below using a Weibull distribution with c and k factors of 10.18 m/s and 2.43, respectively. The figure also shows the estimated energy production of the G80 turbine over its operating speed range in an average year, with peak energy production at 11 m/s wind speed. The aggregate energy is therefore estimated to be approximately 835,000 kWh per annum, which corresponds to a capacity factor of 48% or 4205 full-load hours per annum. This estimated annual energy production and capacity factor are, however, considered to be gross or theoretical as it ignores all the mechanical and electrical losses.
In summary
A wind turbine design must be evaluated against specific site conditions to ensure that the load assumptions of the wind turbine’s design are not exceeded. The following criteria must, therefore, be met for optimal turbine selection:
The 50-year recurrence wind speed at the site is less or equal Vref of the design class conditions.
The annual average wind speed at the site is less or equal Vave of the design class conditions.
The probability density function of the wind speed at hub height is equal to or smaller than the probability density function of the design class conditions.
The characteristic turbulence intensity occurring at the site, is equal to or lower than the one considered in the design class conditions. The effective turbulence intensity shall be considered where relevant.
The normal and the extreme wind shear is equal or lower for all wind directions than those considered in the design class conditions.
The average air density at the site should be lower than the design air density.
The site specific extreme turbulence wind speed standard deviation does not exceed the extreme turbulence model (ETM) used in the design.
Other parameters that are also important when choosing the wind turbine for a site are the electrical considerations (such as the generator type, proximity to grid and compliance with grid codes), the mechanical and aerodynamic noise of a turbine, and transportation of equipment.
In the next article, we will look at some of the electrical considerations when integrating a wind farm into transmission and distribution systems.
Wind as a source of electric energy in the Caribbean is now becoming commonplace, with utility-scale wind power plants in operation on Aruba, Bonaire, Curacao, Cuba, Dominican Republic, Guadeloupe, Jamaica, Nevis, Puerto Rico, and Martinique. Barbados, Guyana, and St. Lucia are next in line to add utility-scale wind energy to their energy mix.
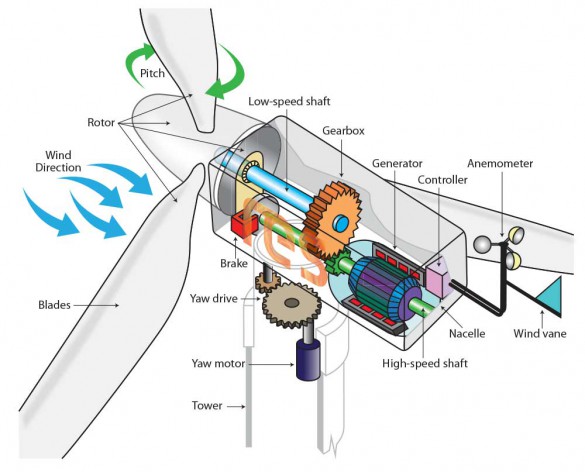
Utility-scale wind power plants consist of several wind turbines, most of which are usually connected to each other in a daisy-chained fashion. The turbine, which is the heart of the plant, converts the kinetic energy of wind into electricity. A modern wind turbine consists of a three-blade rotor that captures the energy from the wind and drives a generator to produce electricity. The rotor and the nacelle, which contained the electric generator and the other necessary parts, are installed at the top of a tower, as shown below. The nacelle and the blades are controlled based on measurements of the wind speed and direction.
parts of a wind turbine
The amount of power that a wind turbine can extract from the wind is primarily dependent on the rotor swept area (A) and the wind speed (U). Therefore, to extract maximum energy from the wind, turbine manufacturers have been increasing the rotor diameter of their wind turbines over the decades, as shown below. Likewise, wind farm developers are always scouting for areas across the globe with high and stable wind speed all year round to develop economically competitive wind projects.
wind turbine growth over the decades
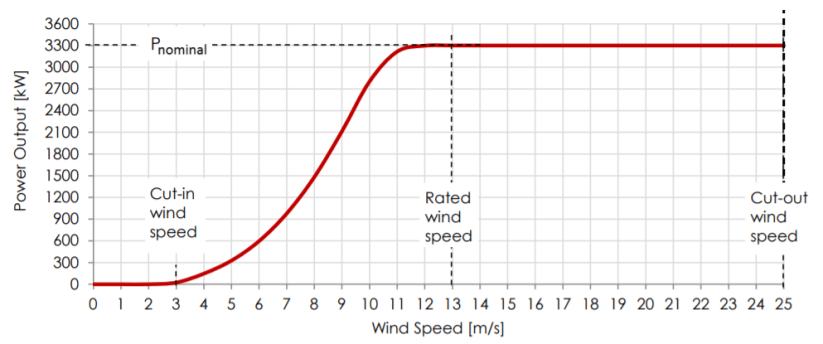
The actual power output of a wind turbine is limited by physical restrictions and is best illustrated by its power curve. The power curve of a wind turbine shows the electrical power output of the wind turbine versus the wind speed. An example of a power curve is shown below. It represents a Vestas V112-3.3 wind turbine as used in the case of the BMR wind farm in Jamaica. It has a rotor diameter of 112 meters and a rated/nominal power of 3.3 MW.
V112-3.3 Power Curve
The operating range of the wind turbine is defined by the cut-in and cut-out wind speeds. At the cut-in wind speed, typically around 3 m/s, the turbine starts to operate and produce electric energy. The cut-out wind speed, 25 m/s in the case of the V112-3.3 turbine, demarcates the upper safe operating wind speed at which point the turbine will stop producing electric energy and shut itself down. The rated wind speed is the wind speed at which the turbine produces its rated power output. The rated power of the V112-3.3 turbine is reached at 13 m/s.
If this wind turbine was to operate at rated power for one hour it would produce 3.3 MWh (3,300 kWh). This is approximately 150% of the annual energy consumption of the average family home in Jamaica. However, wind turbines don’t always operate at their rated power output, due to the variability of the wind speed. Therefore, a measure known as capacity factor, is typically used to assess the efficiency of a turbine or wind farm. It is defined as the average power output of a wind turbine/farm as a percentage of the rated power of the turbine/wind farm.
For most wind turbines erected on land, the capacity factor is between 20-40% or expressed in full-load hours it is around 1,800-3,500 hours per annum. The capacity factor for the Wigton and BMR wind farms in Jamaica are shown in the following table along with their rated power and estimated annual energy production based on their capacity factors.
Wind Farm
Capacity(MW)
Capacity Factor (%)
Annual Energy (MWh)
Wigton I
20.7
35
63,466.20
Wigton II
18
33
52,034.40
Wigton III
24
30
63,072.00
BMR
36.3
34
108,115.92
Munro
3
40
10,512.00
Total
102
32
286,688.52
Capacity Factor for wind farms in Jamaica
From the total install capacity of 102 MW and the total estimated annual energy of 286,688,52 MWh, an overall capacity factor of 32% is estimated.
In part 2, we will look at turbine design parameters for specific wind sites.
The energization of a 5 megawatt (MW) solar farm located on 22 acres of lands at Block 43A Parcel 346 in Bodden Town, Grand Cayman in June of 2017 was recorded in history as the first utility-scale grid-connected solar photovoltaic (PV) power plant in the Cayman Islands.
It is the result of an expression of interest (EOI) issued in 2011 by Caribbean Utilities Company Ltd. (CUC), the sole electric utility company on the island of Grand Cayman, for 13 MW of renewable energy. The EOI was subsequently revised to 5 MW (output) after the two winning bidders were unable to fulfill the requirements of the contractual term sheet.
Entropy Cayman Solar Limited (“Entropy”), a subsidiary of Canadian investment firm Entropy Investment Management, was then selected and a term sheet was signed in October 2013. In 2015, Entropy signed a 25 year power purchase agreement (PPA) and Interconnection Agreement (IA) with CUC, which was approved by the then Electricity Regulatory Authority (ERA) – the electricity regulator, which has since been amalgamated with Communications Technology Authority (ICTA) and the Petroleum Inspectorate to the multi-sector regulator know as the Utility Regulation and Competition Office (OfReg).
The plant was fully commissioned into service in June of 2017, at a cost of US$9.7M, albeit six months behind schedule and over budget by US$2M. It consist of 21,690 poly-crystalline photovoltaic solar panels (305 Watts each), laid out into 52 rows and connected to five 1 megavoltamp (MVA) pad-mounted transformers via 173 30 kilowatts (kW) string inverters, and is interconnected to the national grid at 13.8 kV via the Bodden Town substation.
On an annual basis it supplies 9.4 gigawatt-hours (GWh) of clean electricity and avoids over 4.2 tons of greenhouse gas (GHG) emissions. It employed over 40 people during construction and operations, and purchased over KYD$3 million of local goods and services during construction. All the energy produced is sold to CUC at a competitive initial price of CI$0.1428 cents per kilowatt hour (kWh). The levelized cost of energy (LCOE) is expected to be approximately CI$0.16 cents per kWh over the 25-year life of the PPA.
Another environmentally friendly element of this facility, is that it is sited on a recovered rock quarry. And interestingly, in order to meet the permitting requirement of 155 mph wind loading, being capable of withstanding a category four hurricane, concrete ballasts were used in conjunction with a lower panel tilt angle of 10 degrees (instead of 18 degrees).
Still seen as the launching pad for the Cayman Islands National Energy Policy (NEP) goals to have 70% of total electricity power generated from renewable energy by 2037, the facility was bought over by BMR Energy, a Virgin Group company , in January of this year with the broader objective of expanding their Cayman operations in the future.
The St. Kitts Electricity Company (SKELEC), the sole electric power company on the beautiful island of St. Kitts, owns and operates the twin islands’ second largest solar photovoltaic (PV) farm. The plant, rated at approximate 0.5 megawatts (MW), is located on roughly 100m by 183m of land on the outskirts of the capital city, Basseterre , on the mainland Island of St. Kitts.
The project, which was jointly funded by SKELEC and the Government of the Republic of China (Taiwan) at a cost of approximately US$1.55 million, was constructed by Taiwanese firm SpeedTech Energy and commissioned into service on September 8, 2015.
It comprises of 1,976, 250 W mono-crystalline solar panels and 48 dummies panels which displays the phrase “GO GREEN”. The panels feed into seventeen 30.7 KVA, 3-phase ABB inverters. The output of the inverters is stepped up to 11 KV by a 600 KVA transformer, which is connected to the grid via the Frigate Bay Feeder.
Since commissioning, the plant has supplied over 2000 MWh of energy to the grid and avoided the emission of more than 4,000 metric tons of carbon dioxide. This energy production, however, accounts for less than one tenth of one percent of the energy produced by other sources of power generation on the Island, according to SKELEC.
The solar farm can be monitored over the internet and SKELEC’s website provides live statistics such as power output, energy output since commissioning, irradiance, ambient temperature, wind speed and direction, and environmental data. Click here to view live data
The Barbados Light & Power (PL&P) 10 MW solar PV farm in Trents, St. Lucy is the Island’s first utility-scale solar project.
In 2014, the light and power company invited proposals for a solar photovoltaic system of up to 8 megawatts (MW) on an engineering, procurement and construction turnkey basis, for which over 40 bids were received. However, the proposal by the Spanish firm, Grupotec, to construct a 10 MW (AC) solar on the over 40 acres of land identified by BL&P was selected as the preferred bid.
The project, which consists of approximately 44,500 solar panels, broke ground in January 2016, having signed the EPC contract in late 2015. The plant was officially put into commercial operation in August of 2016, following 8 months of construction and commissioning activities. Also as part of the project, a new substation was also constructed onsite to interconnect the solar facility to the national grid. The project cost a total of approximately US $20 million.
The facility has been in service now for more than two years and it has been reported to be performing as expected. It has been estimated to be delivering fuel savings of approximately US $4.5 million per year.
Since its completion, BL&P announced plans for another solar farm at Lower Estate in St George and is working to make the 10 MW wind farm at Lamberts in St. Lucy a reality, so as to increase its portfolio of utility-scale renewable energy generation.
In addition, the light and power company has a renewable energy rider (RER) program that facilitates the integration of distributed solar and wind energy sources, of sizes up to 500 kilowatts (kW). The program to date has amassed a total of over 12 MW of renewable energy capacity, since first piloted in 2010.
Furthermore, the Government of Barbados is endeavouring to supply 100% of the island’s electricity needs from renewable energy sources by 2030. This forms the basis for the recent enactment of a new Electricity Light and Power Act, in 2013. The new Act opened up the electricity generation market to independent power producers (IPPs), who can now develop utility-scale renewable energy projects and supply energy to BL&P. The act allows for up 20 MW solar and 15 MW of wind to be added by IPP’s.
So while the 10 MW solar farm in Trent, St. Lucy marks the Country’s first utility-scale project, the stage is now set for a lot more to follow.
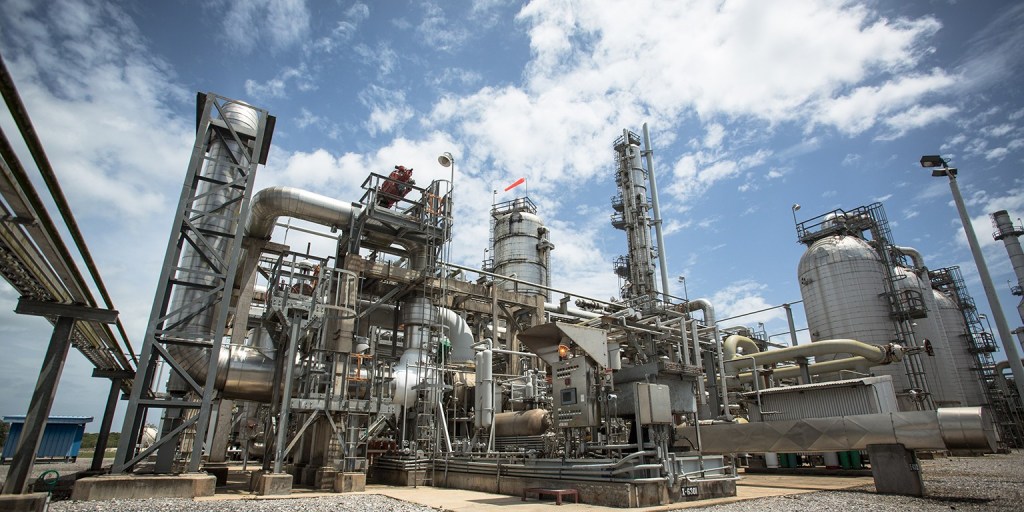
Trinidad and Tobago (T&T), has set an ambitious renewable energy (RE) target of 10% of installed capacity by 2021. This equates to approximately 200 MW given the combined installed capacity of the two islands is over 2000 MW of natural gas based power generation.
T&T is the only nation in the western hemisphere, and the second in the world, that generates 100% of its electricity needs from natural gas. Therefore, unlike the other islands in the Caribbean T&T is already energy independent, since all the natural gas used is sourced locally through its sophisticated network of pipelines. As a consequence, T&T have seen the lowest and most stable electricity rates in the region over the last decade.
Given that T&T is already energy independent, the integration of renewables will have the effect of reducing the natural gas demand for electricity production and thereby increasing the levels available for export and/or for use in the well developed local petrochemical industry. This is now being championed by the energy sector as a means to increasing government revenues in a time when the nation is witnessing a significant decline in revenues and consecutive budget deficits.
We decided to weigh in on the potential savings to be derived from this level of renewable energy integration. In order to do this we first had to assume a mix of renewable energy technologies. Since the objective is to use renewables as a means to reduce the consumption of a natural gas and thus increase government revenues, it thus implies that the 200 MW will come from utility scale renewable energy projects only.
We therefore opted to break up the 200 MW into 120 MW of onshore wind, 60 MW of solar pv and 20 MW of waste to energy. No consideration is given to the technical feasibility of this RE mix. There are, however, ongoing discussions on the subject of undertaking solar and wind resource assessments and there are currently no known technical barrier limiting grid connection.
As the based case, we looked at Jamaica, which has over 150 MW of utility scaled renewables connected to the grid, to formulate a case for wind and solar in T&T. In 2016, Jamaica commissioned 60 MW of wind and 20 MW of solar capacity at a cost of approximately US $200 million.
If we use the 36 MW BMR Wind Farm in Jamaica, commissioned in 2016 at a cost of US $90 million, as an example then, 120 MW of utility scale onshore wind capacity should not cost T&T more than US $300 million in 2018, given that the capital cost of onshore wind fell by 20% between 2010 and 2017. Conservatively, 120 MW of wind can generate 285,000 MWh annually, thus avoiding the use approximately 2,850,000 MMBTU of natural gas annually for the production of electricity.
Similarly, if we use the 20 MW Content Solar Farm in Jamaica, also commissioned in 2016 at a cost of US $63 million, then 60 MW of utility scale Solar PV should not cost T&T more than US $190 million in 2018, since the capital cost of solar PV fell by 68% between 2010 and 2017. 60 MW of solar can conservatively generate 95,000 MWh annually, thus avoiding the use of approximately 950,000 MMBTU of natural gas annually.
There has been some discussion around the potential of a waste to energy (WtE) facility at the country’s largest landfill, located on the outskirts of the capital city. The Solid Waste Management Company (SWMCOL) estimates that the landfill receives approximately 1000 tonnes of uncharacterized waste daily. We estimate that a 20 MW WtE facility can be developed at the proposed site to produce energy for the national grid.
Using the information on the Solid Waste Authority of Palm Beach County Renewable Energy Facility 2 (REF2), a 100 MW mass burn WtE facility commissioned in 2015 at a cost of US $672 million, we assume, therefore, that a similar facility rated at 20 MW should not cost T&T more than US $150 million. Given that a mass burn WtE facility is a steam power plant at its core, then a 20 MW plant should generate approximately 150,000 MWh annually and thus avoiding the use of approximately 1,500,000 MMBTU of natural gas annually.
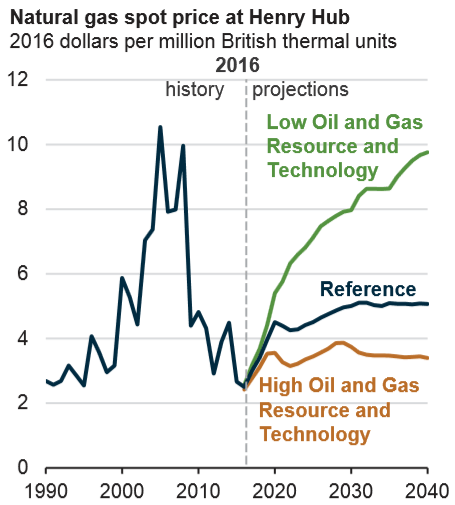
Therefore, from our selected portfolio of renewables we see that the potential exist to avoid approximately 5,300,000 MMBTU of natural gas annually. However, this does not come cheap as total investment cost estimates to US $640 million. The chart to the left shows the projected price of natural gas up to 2040.
If we therefore look at the pessimistic case, we see that the price of natural gas in the US is projected to vary between US $3.00 to $4.00 over the remaining period and averages about US $3.50. Using this price we estimate a potential earning of US $18.6 million annually. The optimistic outlook, on the other hand, shows an average price of approximately US $6.80 resulting in a potential earning of US $36 million per annum.
Both the pessimistic and the optimistic outlooks gave very large negative net present values using a 10% discount rate over a 20 year period. The optimistic case only gave a positive net present value for a discount rate of about 1%. The analysis assumes that the projects would be government owned and did not take into consideration the operation and maintenance cost over the life of the project. Overall, it shows that the projected revenues to be derived from the sale of the avoided natural gas on the open market will not return the capital invested over a 20 year horizon.
The Jamaican electricity sector has seen its fair share of investment in renewable energy over the last two decades or so, to the tune of approximately US$360 million to be exact.
Development to date:
Jamaica has a long history of using its indigenous renewable sources of energy to generate electricity. This dates back as far as 1955 when the Upper White River hydroelectric power plant was inaugurated. The recent thrust to incorporate other forms of indigenous renewable sources of energy into the country’s energy mix started with the installation of a 225 kW wind turbine in 1996 at the Munro College campus, in St. Elizabeth, some fifty years later.
The success of the Munro installation led to the development of the country’s first commercial wind farm in 2004, the 20.7 MW Wigton I plant located in the neighbouring parish of Manchester. The plant had its fair share of issues, ranging from technical to financial, but the experience gained led to an 18 MW expansion in 2010, dubbed as Wigton II. In 2010 the utility company, the Jamaica Public Service (JPS) Company, also completed its first wind farm, a 3 MW plant located in close proximity to the Munro campus.
The publishing of the country’s national energy policy in 2009 and it’s draft renewable energy policy in 2010 prompted the development of several renewable energy projects. The first was a 7.2 MW expansion of JPS’s Maggotty hydroelectric plant in 2014. Then in 2016, the country witnessed the largest commissioning of renewable energy plants in a single year, closing out the year with a whopping total of 80 MW. This consisted of the 24 MW expansion of the Wigton Wind Farm (Wigton III), the 36 MW privately owned Wind Farm in St. Elizabeth, and the 20 MW Solar Farm in Clarendon, also privately owned.
A near term outlook:
The next renewable energy project on the horizon is the 33.1 MW Eight Rivers Solar Farm in Paradise Park, Westmoreland. In 2015, this project was selected by the Office of Utilities Regulation (OUR) from a list of 19 bids, received in response to a request for proposal (RFP) for renewable energy with capacity up to 37 MW. The privately-owned solar farm broke ground last month and is expected to be completed by December 2018 at an estimated cost of US$48.7 million dollars.
Once completed this solar farm will be the second, but largest, solar installation on the island and it will feed electricity into the JPS grid at US$0.0854 per kWh. At this feed in rate, which is less than half that of the other solar farm on the island, this project has proven that renewable energy projects can rival conventional generation and it sets a new price ceiling for future renewable energy projects in Jamaica.
Though the potential for wind energy on the island has not yet been exhausted, the Petroleum Corporation of Jamaica (PCJ), the parent company of Wigton Windfarms Ltd, is seeking to quantify the country’s offshore wind potential. The PCJ applied for and was awarded, in October of last year, a grant from the United States Trade and Development Agency (USTDA) to undertake a feasibility study of the island’s offshore wind potential. Preliminary work should have started during the final quarter of 2017 and the study is scheduled to last for 12 months. Should it proves feasible and leads to the development of viable offshore wind farms; it will be another first for Jamaica and the wider Caribbean.
Grid storage is also on the horizon if JPS is successful in obtaining the necessary approvals from the OUR. In May of last year, JPS sent out an RFP for the supply and installation of a 13 or 24.5 MW hybrid energy storage system. According to the light and power company, this system is required to smooth the effect of the intermittent renewable energy sources presently on the grid and also to provide other essential grid services such as frequency support, voltage support, and spinning reserve.
Dubbed as a first of its kind in the Caribbean, this energy storage system will utilize a combination of high-speed and low-speed flywheels and containerized lithium-ion batteries and is to be located at the Hunts Bay Power Plant substation. Once approved by the regulator, it is expected to be completed by the third quarter of 2018 at an estimated cost of US$21 million.
The Government is currently putting together an Integrated Resource Plan (IRP) with the intent to guide the development of a modern energy sector in Jamaica. The IRP is expected to establish the projected electricity demand over the next 20 year period, determine the generation capacity and technologies to be used to satisfy this demand, and to establish agreements on the transmission and distribution infrastructure to generate and deliver the needed electricity and the resulting tariffs.
The IRP, which was originally slated for completion late last year, when completed will give all stakeholders, including the investment community, a clear view of the agreed suite of medium to long term investment opportunities necessary to achieve the island’s 2030 renewable energy target of 30%.